These days, I have talked about the long-term perspective for investing. Today, I will provide an example to help us avoid being shortsighted.
How to make a stable life
Sometimes, we want a life with long-term stability and peace, rather than pursuing excitement while ignoring the future, especially if we are empathic and creative. We can consider the future and find many risks in our lives. That makes us want stability.
Investment would be an effective way to create such a stable life. By using the current surplus effectively for the future, we can become abundant gradually. Although it requires wisdom and self-control, we are good at them thanks to our empathy and creativity.

In investment, taking a long-term perspective would be better, in my opinion. The wider and more historical perspective gives us various opportunities.
However, we are sometimes unconsciously influenced by the narrow sight of our surroundings. Our surroundings often try to control us through information, especially organizations that seek social impact, such as political or ideological collectives. A lot of news or topics from them could confuse us.
Today, I will introduce an example of how we fall shortsighted. There is a psychological trick in the graphs many people use. This knowledge might provide us with a solid, long-term perspective.
How a graph distorts reality
We sometimes unconsciously eliminate the facts that go against our wishes, especially when we want to influence others. That distorts our recognition of reality.
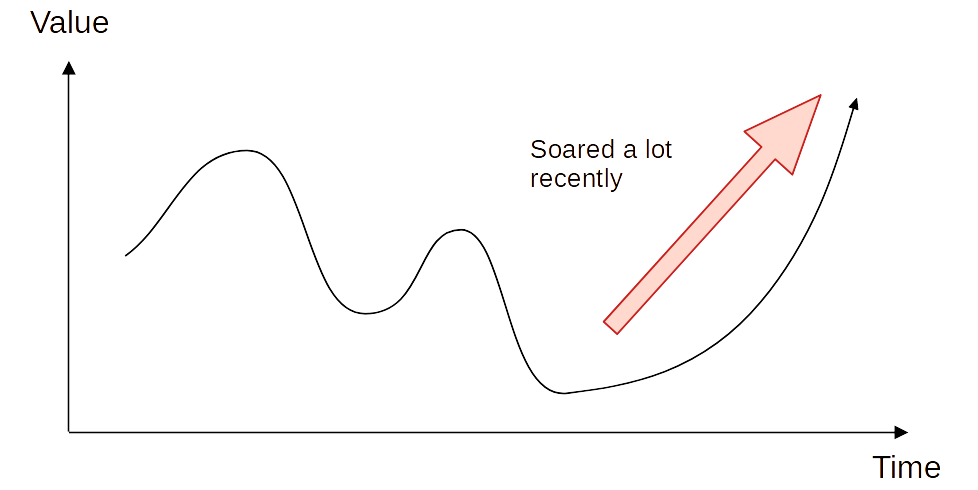
An example would make it easier to understand. Assume something has changed a lot lately, such as the global temperature or price of something, as shown in the following image:
The graph trick to control people
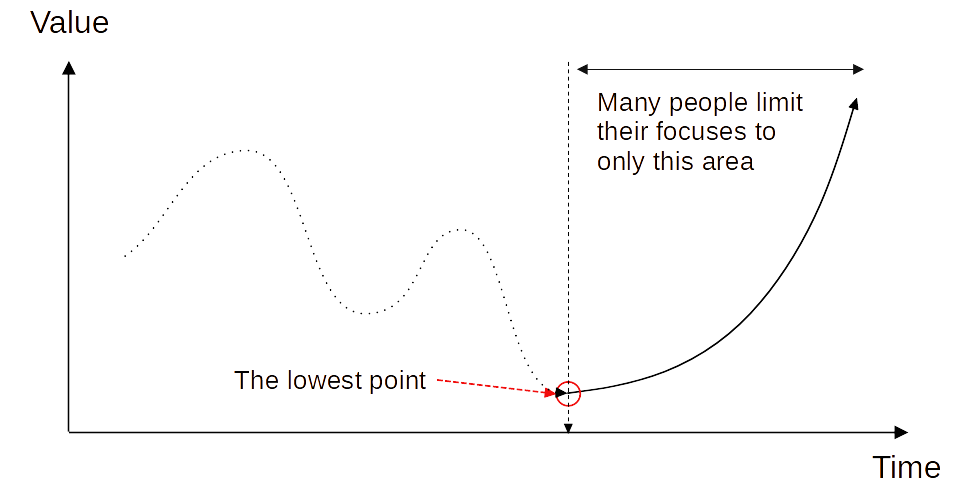
Assume we are surprised by this change. In this case, many people make graphs separated by the period of the greatest recent difference, consciously or unconsciously, as shown in the following image:
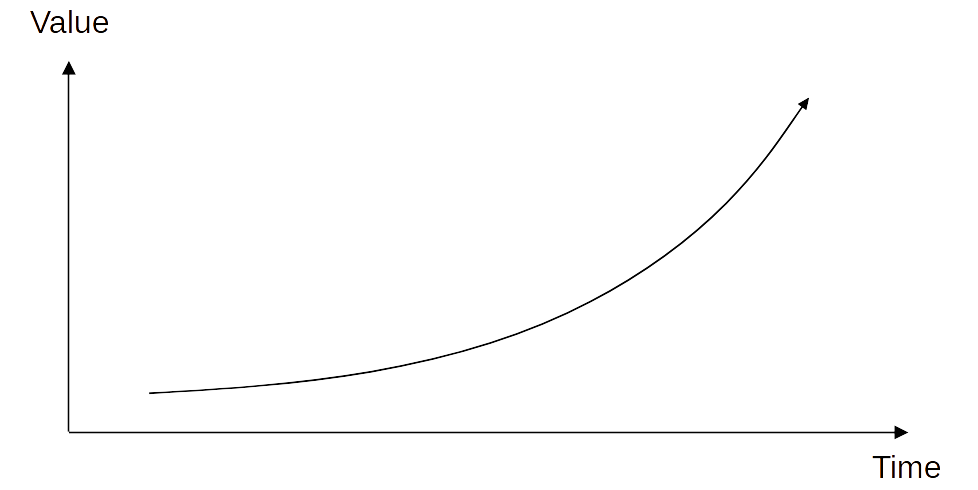
Then, the following graph, a continuously or exponentially rising graph, which we often see, is produced:
Manipulating people with the graph
With this graph, they will threaten us. “The value has continued to rise so far, and it is clear what is going to happen soon! You should do as I say!”
If we think about it calmly, we can see that this is unnatural because there are more historical fluctuations. Even if it is something young, nothing will continue to grow. Just because the value or price kept rising today doesn’t mean it will continue to rise tomorrow. The past and the future are different. If we invest in something, we will understand it clearly.

However, many people believe this logic is trustworthy because their data is shown scientifically. They cannot recognize the past fluctuations that are not shown there. That often drives people to fear and greed.
That is a way to manipulate people with their information. They are not lying. They are only hiding one side of the historical truth.
Understanding the unnatural graphs
This is a common technique used when people want to influence others. They hide inconvenient parts and scientifically present only the parts that fit their argument. Even if they don’t have malicious intent, they could unconsciously do so to emphasize their point.
Although it has an impact on people, believing it will be fatal in investing because it distorts our recognition of reality.
Understanding the trickery prevents our losses. Many people believe the future goes only in one direction. That makes them make a mistake confidently. On the other hand, we know there could be fluctuations and cycles in the economy. We make profits by being cautious and not confident.
That is why people who want to change society are not suitable for investment. We, except several influential people in the world, cannot change the market or the economy because it is huge. People who try to change themselves without trying to change society, such as people who want seclusion in the countryside, are suitable for investing.
The natural graphs
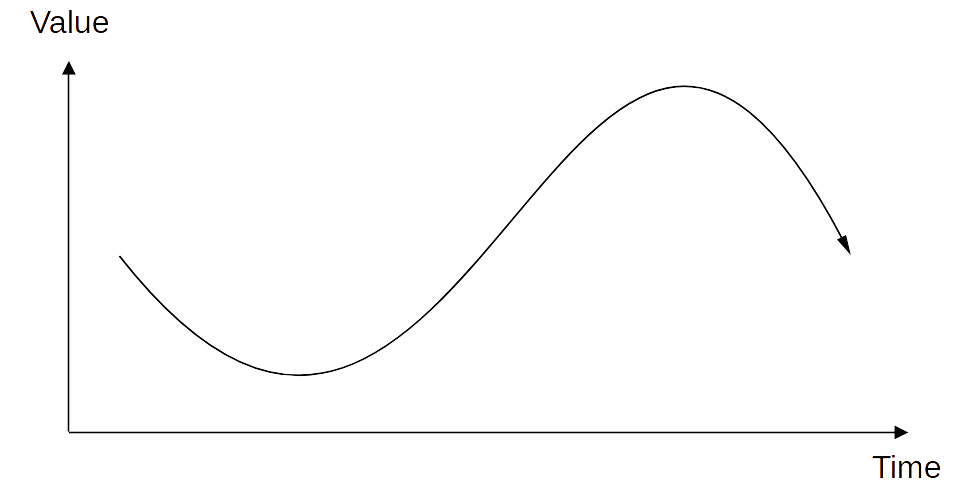
To avoid being fooled by those graphs, being aware of the natural graph would be better.
A natural graph would be in the form of a wave, as shown in the following image:
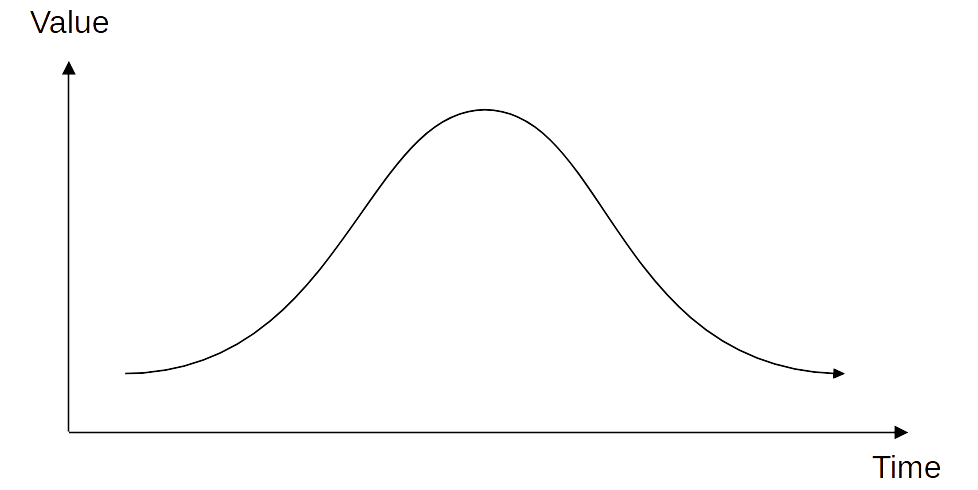
A normally distributed graph is also a type of wave, as shown in the following image:
What to trust
Those natural graphs tend to have no hidden intention. We can trust them in the long term.
This world is changing. We are also changing.

It tells us that the future doesn’t go only in one direction. The painful past doesn’t always continue in the future. We don’t know if the future is hopeful or hopeless. However, we can prepare for it to be abundant.
Perhaps that would be the fundamental of the super-long-term investment.
Conclusion
That is an example of how we fall shortsighted.
There is a psychological trick in the graphs many people use.
This knowledge might provide us with a solid, long-term perspective and profits.
Thank you for reading this article. I hope to see you in the next one.